OCZ Vertex 450 Solid State Drive Review
Test Setup, IOMeter 1.1 RC
Our Test Methods: Under each test condition, the Solid State Drives tested here were installed as secondary volumes in our testbed, with a standard spinning hard disk for the OS and benchmark installations. Out testbed's motherboard was updated with the latest UEFI available as of press time and AHCI (or RAID) mode was enabled. The SSDs were secure erased before testing and left blank without partitions wherever possible, unless a test required them to be partitioned and formatted, as was the case with our ATTO, PCMark 7, and CrystalDiskMark benchmark tests. Windows firewall, automatic updates and screen savers were all disabled before testing. In all test runs, we rebooted the system, ensured all temp and prefetch data was purged, and waited several minutes for drive activity to settle and for the system to reach an idle state before invoking a test.
|
Motherboard - Video Card - Memory - Audio - Hard Drives -
|
Hardware Used: Intel Core i7-2600K Asus P8Z6-V Pro (Z68 Chipset, AHCI Enabled) NVIDIA GeForce GTX 285 4GB Kingston DDR3-1600 Integrated on board WD Raptor 150GB (OS Drive) Samsung SSD 830 (256GB) OCZ Vertex 450 (256GB) OCZ Vertex 3.20 (240GB) Corsair Force GT (240GB) Crucial M4 (256GB) OCZ Vector (256GB) OCZ Vertex 4 (256GB) |
OS - Chipset Drivers - DirectX - Video Drivers - |
Relevant Software: Windows 7 Ultimate SP1 x64 Intel 9.2.0.1030, iRST 10.5.1027 DirectX 11 NVIDIA GeForce 275.33 Benchmarks Used: IOMeter 1.1.0 RC HD Tune v4.61 ATTO v2.47 AS SSD CrystalDiskMark v3.01 x64 PCMark 7 SiSoftware Sandra 2012 |
|
As we've noted in previous SSD articles, though IOMeter is clearly a well-respected industry standard drive benchmark, we're not completely comfortable with it for testing SSDs. The fact of the matter is, though our actual results with IOMeter appear to scale properly, it is debatable whether or not certain access patterns, as they are presented to and measured on an SSD, actually provide a valid example of real-world performance for the average end user. That said, we do think IOMeter is a reliable gauge for relative available throughput within a given storage solution. In addition there are certain higher-end workloads you can place on a drive with IOMeter, that you can't with most other storage benchmark tools available currently.
In the following tables, we're showing two sets of access patterns; our custom Workstation pattern, with an 8K transfer size, 80% reads (20% writes) and 80% random (20% sequential) access and another with 4K transfers, 100% random, 100% writes.
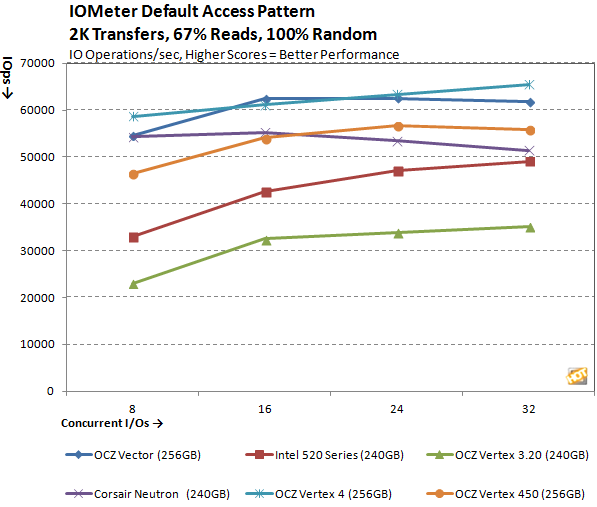

In the default access pattern test, the OCZ Vertex 450 starts out in the middle of the pack, although as the concurrent I/Os ramp up, the drive performance improves. That pushes it past the Corsair Neutron into third place behind the OCZ Vector and Vertex 4. (It’s worth noting that the new SandForce-equipped Vector 3.20 performed poorly compared to the rest of the field in this test.)
In our custom workstation access pattern, which uses a larger transfer size and more of a mix of random and sequential access, the Vertex 450 does a little better, starting and finishing relatively close to the Intel 520 and OCZ Vector while soundly outpacing most of the rest of the field. In this test, the Vector 3.20 fared substantially better, too.

It’s more of the same in total transfers, with the Vertex 450 finishing in third place in both the default and workstation access tests.